On November 21, Ctrip and MasterCard jointly released the 2018 Chinese Cross-border Travel Consumption Report based on the data collected from 2016 to 2018 to analyze new trends, consumer behavior and customer segmentation of China's outbound and inbound tourism. The report also provides insights and suggestions for relevant industries and institutions.
Outbound Tourism
1. Post-90s, post-00s and female travelers driving the fastest growth
In January to September, the generations born in the 1990s and 2000s accounted for more than 30% of the total number of outbound travelers, surpassing the generation of 1980s for the first time. The average expenditure of those born after 2000 was close to 6,000 yuan. The proportion of females opting for free independent travel increased from 46% in 2016 to 58% in 2018, while the proportion of their male counterparts decreased from 54% to 42%.
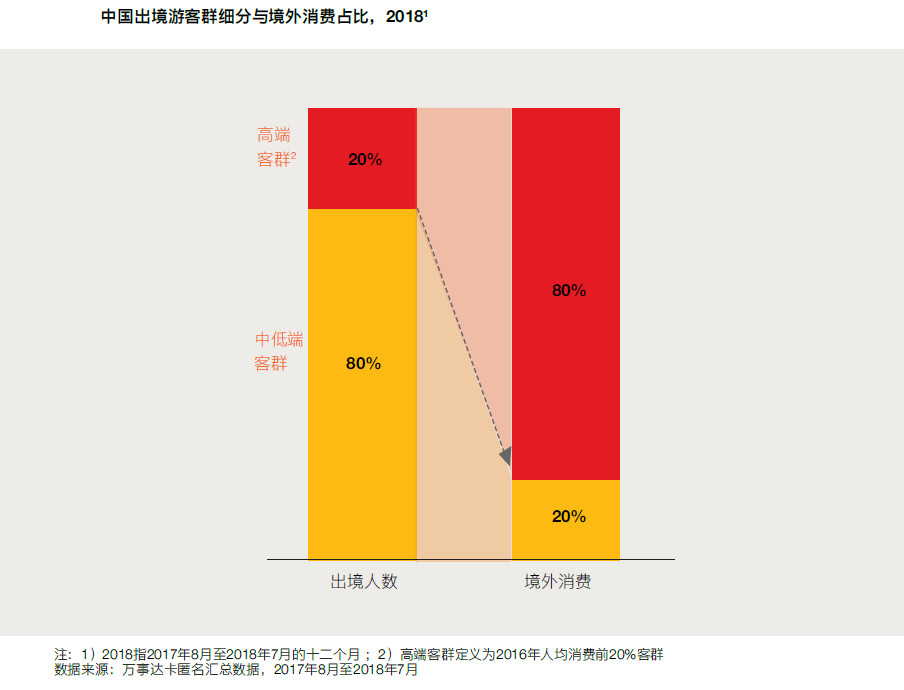
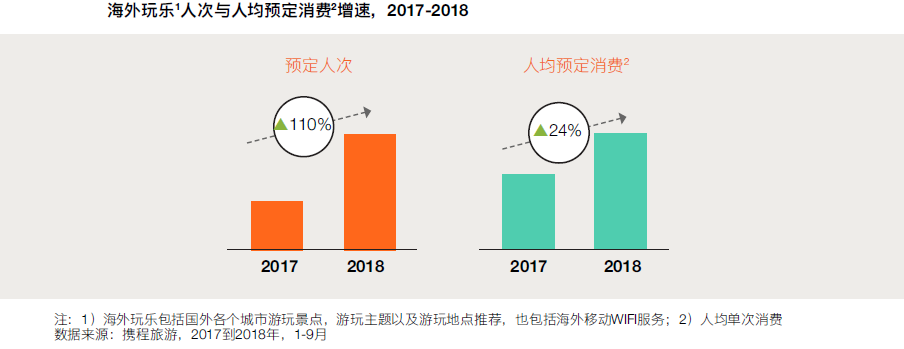
2.The number of high-end tourists and their per capita consumption showed the highest increase, and tourists preferred experiences to shopping
High-end travelers, who comprised 20% of the total number of travelers, contributed to 80% of the total outbound spending. The number of people booking entertainment services and products and their spending jumped by 110% and 24% respectively.
3. Niche markets being explored to suit visitors’ demand for personalized trips
The number of people taking part in “private groups” spending over RMB 7,000 each increased 177%.
4. Family travel becoming increasingly popular thanks to the two-children policy
The compound annual growth rates in the number of family trips and the consumption level were 23% and 28%, respectively.
5. Growing awareness of insurance needs and safety due to increased incidences such as natural disasters.
The number of people who bought overseas travel insurance products has increased by nearly 40% annually.
Recent data released by Ctrip showed that tourists younger than 29 accounted for nearly 50% of the total number of its users, representing the fastest-growing group. About 70% of the customers were under 35.
The proportion of female FIT travelers had been growing steadily year after year, and they constituted 58% in 2018, 16 percentage points more than male travelers. Females spent an average of RMB 6,254, 14% more than males. Females traveling with their female friends spent RMB 1,000 more than males traveling with their male friends.

First-tier cities, such as Beijing, Shanghai, Guangzhou and Shenzhen, were still the main sources of outbound tourists. With more direct air routes and easier visa policies, the number of outbound tourists from second-tier cities was growing rapidly, and the annual growth rate of the number of travelers from these cities was more than 250%.
The number of travelers from second-tier cities and their average expenditure had been growing at a faster rate than those from first-tier cities, according to data released by Ctrip.
A significant increase in per capita travel consumption reflected tourism consumption was going upmarket –the per capita spending on short-distance outbound travels grew by 7% to exceed 4,800 yuan, and the spending on long-distance travels exceeded 7,500 yuan.
The Ctrip data showed that the number of bookings for overseas entertainment products surged by 110%, and per capita consumption rose by 24% year-on-year. Ctrip has added 350,000 products to its Thing-To-Do platform, ranging from attraction tickets and performances to hot-air balloon rides and day cruises.
According to MasterCard’s consumption data, Chinese tourists’ spending in the United States, Australia, Canada and Japan still ranked top, and the spending level continued to increase rapidly. Thailand, Japan, Vietnam and Singapore remained the most popular destinations for Chinese tourists –Thailand alone received over 10 million Chinese arrivals so far in 2018.
The report also found that, among the top 20 destinations that were the most popular with repeat visitors, 14 reported that 10% of their Chinese visitors had visited for three years in a row. Canada, the United States and Australia boasted the highest rate of repeat visits by Chinese visitors.
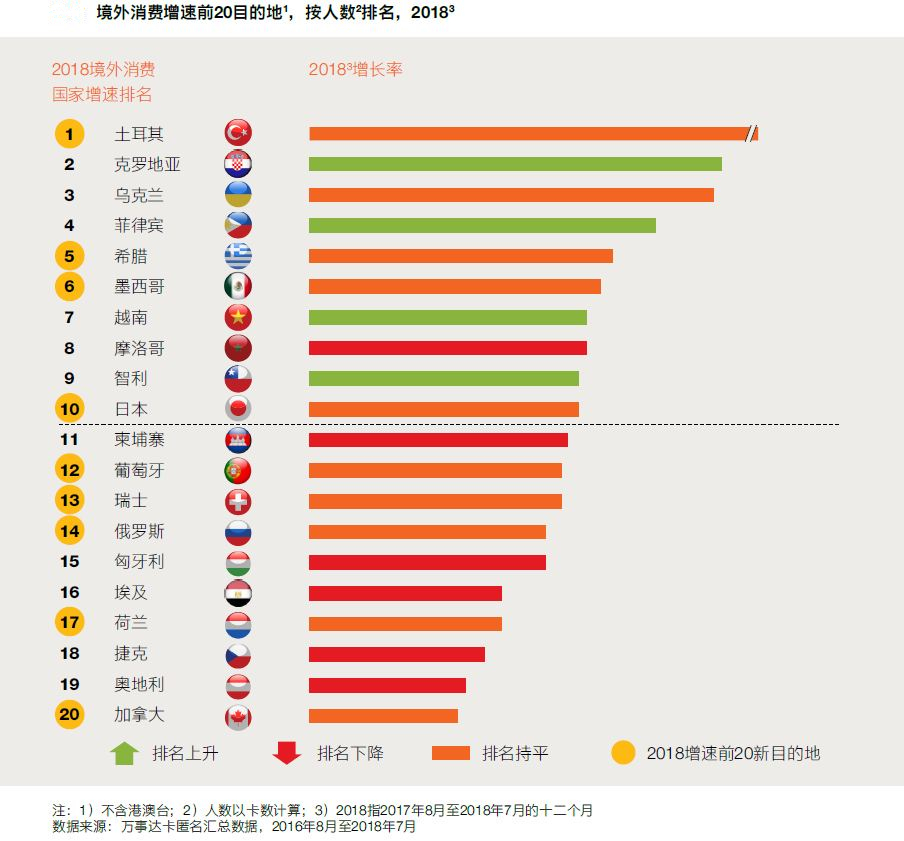
Turkey, Greece, Mexico, Japan, Portugal, Switzerland, Russia, the Netherlands and Canada made it to this year’s list of top 20 destinations registering the highest increase in the number of Chinese consumers.
Inbound Tourism
Chinese cities continued to show strong appeal to international tourists. In 2016-2018, China's inbound tourism recorded a 7% increase in tourism receipts and 9% in arrivals.
• Leisure travel spending continued to account for the bulk of tourism receipts, but corporate travel consumption had hiked in the past two years, driven by close economic and trading ties with overseas markets.
• The compound annual growth rate of business travel consumption is 6 times that of leisure travel consumption.
• Business travelers from the United States and the United Kingdom were the biggest spenders in business travel in China. While Beijing, Shanghai, Guangzhou and Shenzhen were still the big four destinations for business travelers, the growth rate of business consumption in non-first-tier cities surpassed that of the first-tier cities.
• The United States remained the largest source of leisure tourists to China.