ChinaTravelNews - The China National Tourism Administration has published Q4 tourism statistics for 2014 in the “Tourism Statistical Review”, with data from 26,005 travel companies, representing a response rate of 97.58%.
Following are the results of the survey.
Domestic tourism highlights
Domestic tourism grew 2.93% y-o-y in terms of trips and 2.23% in terms of trip/days, to 36.7843 million trips and 11.73590 million trip days respectively in Q4 2014.
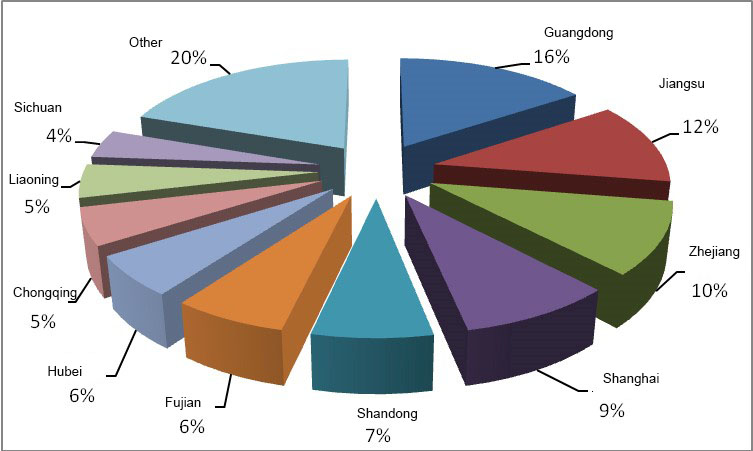
The top ten domestic destinations in terms of trips were: 1.Guangdong 2. Jiangsu 3. Zhejiang 4. Shanghai 5. Shandong 6. Fujian 7. Hubei 8. Chongqing 9. Liaoning 10. Sichuan
Model 1: The top ten domestic destinations in terms of trips in Q4 2014
The top ten domestic destinations in terms of trip/days were: 1. Jiangsu 2. Zhejiang 3. Guangdong 4. Fujian 5. Shanghai 6. Hubei 7. Yunnan 8. Sichuan 9. Shandong 10. Chongqing
Model 2: The top ten domestic destinations in terms of trip/days for Q4 2014
Outbound tourism
Outbound trips organized by China’s travel companies grew 22.61% and trip/days grew 29.68% y-o-y in Q4, totaling 10.7121 million trips and 60.3123 million trip/days.
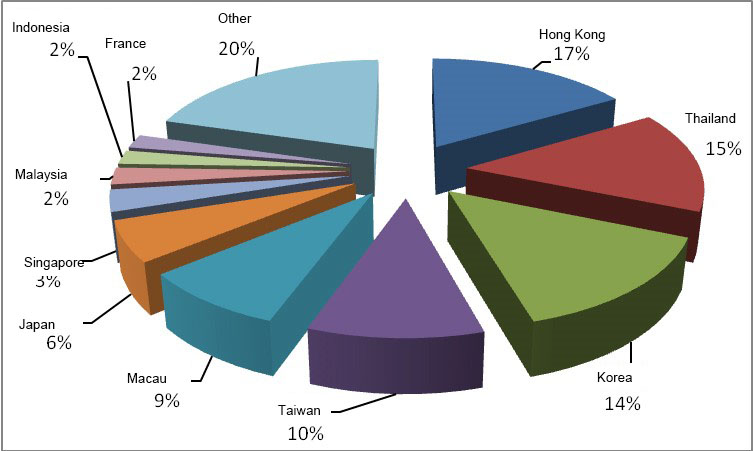
The top ten outbound destinations in terms of trips were: 1. Hong Kong 2. Thailand 3. Korea 4. Taiwan 5. Macau 6. Japan 7. Singapore 8.Malaysia 9.Indonesia 10. France
Model 2: The top ten outbound destinations in terms of trips in Q4 2014
Inbound tourism
In Q4, China’s travel companies also recorded 4.4152 million inbound trips and 20.2603 million inbound trip/days, up 0.02% and 0.23% y-o-y respectively.
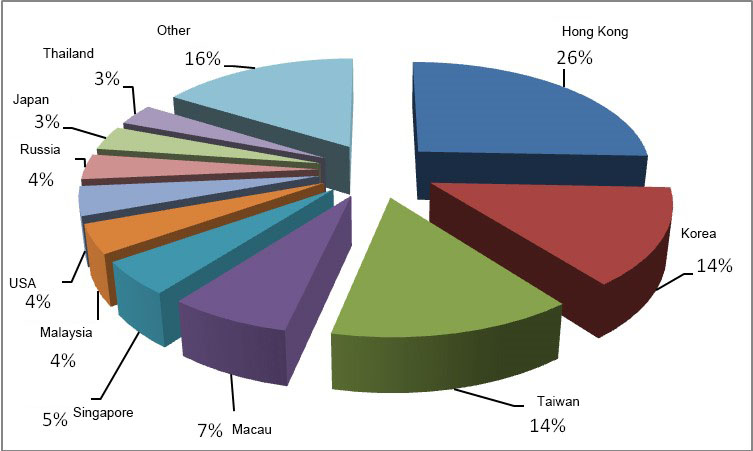
The top ten inbound visitor source markets were: 1. Hong Kong 2. Korea 3. Taiwan 4. Macau 5. Singapore 6. Malaysia 7. USA 9.Russia 10. Japan
Model 3: The top ten inbound visitor source markets in Q4 2014
Trip data
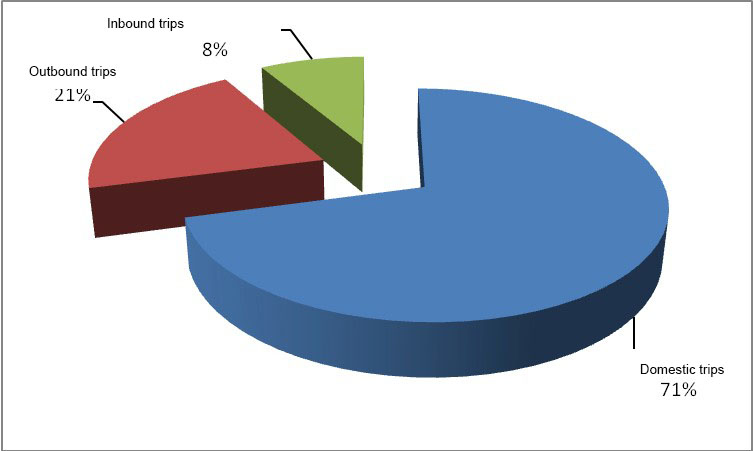
Domestic tourism, outbound tourism and inbound tourism accounted for 71%,21% and 8% respectively of the total number of trips recorded, which is -2%、3% and-1% y-o-y respectively.
Model 4: Tourism composition in trips for Q4 2014
Trip/day data
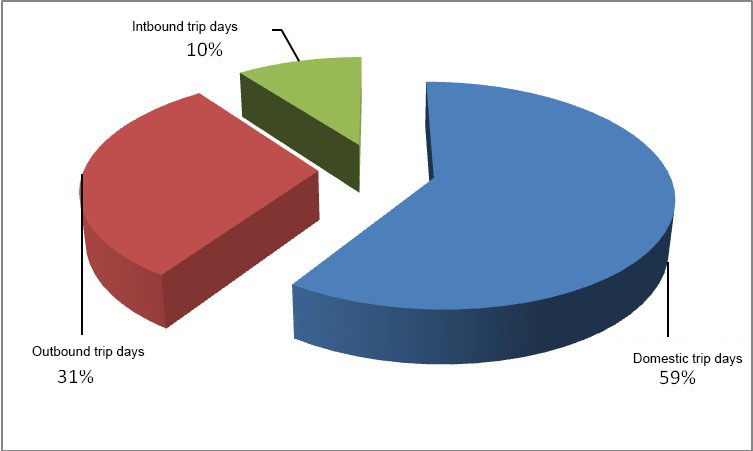
Domestic tourism, outbound tourism and inbound tourism contributed 59%,31% and 10% respectively of the total number of trip/days recorded, which is -4%、5% and-1% y-o-y respectively.
Model 5: Tourism composition in trip/days for Q4 2014
(Translation by David)

