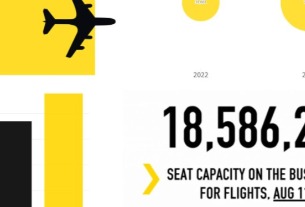
In August 2014 carriers worldwide will add 17.1 million new seats compared to August 2013, according to OAG FACTS. This increase of 5% takes total seats to 396.6 million. Flights will grow by 3% to 2.9 million. The Middle East has the fastest growing to/from capacity this month, up 10% compared to last August, with carriers adding 1.5 million seats, taking the total to 17.2 million seats.
The only region which will see a decline in capacity in August 2014 are seats within North America, which will be 1% lower. We explore some of the reasons for this in more depth below.
Is US government policy a blunt instrument?
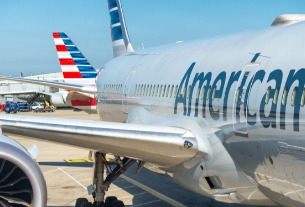
As part of the merger settlement announced by the US Department of Justice (DOJ) in November 20131, both US Airways and American Airlines agreed to give up several hundred slots at seven constrained airports across the US. Those slots were intended for low-cost carriers such as JetBlue and Southwest Airlines, in order to keep prices low for consumers who might be affected by the increasing consolidation in the US airline industry. Divestitures were to take place at airports in Boston, Chicago, Dallas Love Field, Los Angeles, Miami, New York’s La Guardia Airport and National Airport, Washington, D.C. Earlier this year2 we explored the implications for market share on some of the biggest US domestic routes and airports.
The stated intention of the US DOJ was to facilitate vigorous competition to ensure customers benefit from more competitive prices and enhanced travel options, but such policy actions can often be blunt instruments. As we enter the peak season for the US holiday market, and media stories abound on the subject of whether there is enough capacity to serve demand this summer, we explore in more detail the current state of the US domestic market.
US domestic capacity is down in August 2014 vs August 2013. The fall is 1%, which translates to just under 25,000 seats per day. Broadly, this fall is comprised of a drop in capacity among the three big US majors (American/US Airways, Delta and United) and an increase in capacity among the larger low cost carriers (LCCs) and the larger full service carriers (FSCs). Between them, American/US Airways, Delta and United will offer 600,000 fewer seats than last August.
Overall, LCCs will maintain capacity at a similar level to last August, but Southwest has 4% more seat capacity, JetBlue has 2% more, Spirit has 15% more and Frontier Airlines has 13% more. Airtran will see capacity fall by more than 50% as they progress towards full integration with Southwest. The combined Southwest/Airtran position is a reduction in seat capacity of 3%. Both Jetblue and Southwest are pursuing international growth, with seat increases of 18% and 171% respectively, perhaps at the expense of their domestic market positions?
Alaska Airlines, Frontier Airlines and Spirit Airlines - also among the top 10 US domestic players in terms of seat capacity in August 2014 - are adding significant capacity, with year-over-year increases of 9%, 13% and 15%, respectively.
Impact on airline concentration
Despite some significant increases in seat capacity by some airlines, the sheer dominance of the biggest carriers means that these increases make relatively little impact on airline market share. In fact, between August 2013 and August 2014 the share of domestic seats operated by the top 10 carriers grew from 94% to 96% meaning that the market is now more concentrated than it was a year ago.
It is true that each of the largest carriers have reduced the number of seats on offer but AA/US still have a combined 24% share of the US domestic market and Delta still has 22% of the market, while Southwest has 21% and United has 16.5%. Despite their apparently large capacity increase, in fact the LCCs - JetBlue, Spirit and Frontier - only gain half a percentage point in market share between them.
American Airlines reduced seats by 196,000 in August 2014 compared to the previous August, while US Airways actually increased seats by 31,000, leading to a net loss of 166,000 seats between them. So despite the requirement to give up slots at some major airports, the merged entity will only operate 0.9% fewer seats this August compared to last August.
Has divesting slots worked?
The DOJ ruling concerning the merger of America Airlines and US Airways specifically mentioned JetBlue and Southwest Airlines. In August 2014 these carriers will have increased their share of seat capacity at three of the seven airports where slots were to be given up by AA/US. These slots are at BOS, DCA and LGA where JetBlue and Southwest have together increased their share of capacity by 3%, 7% and 4%, respectively.
At DAL JetBlue and Southwest dominated capacity already and their 97% share remains unchanged. American’s slots (leased to Delta) will change hands when Virgin America start operating this October.
At LAX there has been a very modest shift in airline shares with AA/US/DL/US losing 1% of seats and carriers other than JetBlue and Southwest gaining 1% of seats.
At MIA the four large legacy carriers’ position remains unchanged from a year ago in that they continue to operate 100% of seats.
Finally, at ORD, a small movement in capacity has occurred away from the big legacy carriers to carriers other than JetBlue and Southwest.
Will less capacity and higher loads mean higher airfares?
According to data from OAG’s DOT Analyser - the latest addition to OAG Analyser which consolidates three key datasets (T100, Form 41 and O&D Reports) - load factors in the US domestic market have been rising steadily year-on-year for the past five years.
For example, United Airlines recorded an average load factor of 81.2% in the 12 months to April 2010, and this has risen in each subsequent 12 month period except one. In the latest data which covers the 12 months to April 2014, the United Airlines average load factor was a record 84.9%. Although slightly lower, the other main FSCs exhibit similarly rising load factors.
At Spirit and Frontier load factors have reached 87% and 91%, respectively. At these levels it would not be surprising if airlines were spilling passengers.
It may be too early to come to a verdict on the effectiveness of the DOJ ruling in increasing competition and keeping fares low for consumers but the evidence so far doesn’t look like it is in their favour. The combination of reduced capacity in the peak month of August, and rising load factors, may well lead to higher fares for passengers this summer as carriers seek to manage demand. In turn we are likely see consumers changing behaviour by starting to book earlier to try secure competitive fares at peak times - but these are longer term impacts and the prognosis is not yet clear as we head into another hot summer.
In the short to medium term we may yet see growth in the US Domestic market once the dust settles from what has been almost constant consolidation amongst the US majors in recent years, and more recently in the LCC sector with Southwest’s takeover of Airtran.